


Wild fires in Victoria: the debate is over
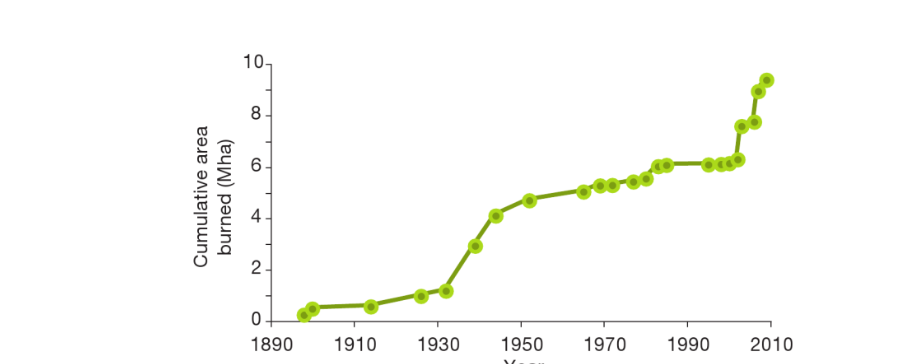
The graph below comes from Tony Eggleton, “A Short Introduction to Climate Change”, Cambridge University Press, 2013), Fig. 12.4, page 200.
The caption in part says: “Gentle slopes in this graph from 1896 to 1930, and again from 1955 to 2000, suggests more-or-less average climatic conditions. Sharp rises in fire extent from 1939 to 1952, and again after 2000, might reflect rising temperatures in the preceding years.”
In the Weekend Australian recently, Gerard Henderson has named a number of years when Australia has had wild-fires. Following are those years and the size of areas (hectares) of burning, listed in Wikipedia.
I851 Black Thursday Vic. 5Mha
1939 Black Friday Vic. 2Mha
1983 Ash Wednesday SA, Vic 418,000ha
2009 Black Saturday Vic. 450,000ha
2019 – NSW, Q, SA, Tas, Vic, WA 5.9Mha and continuing
Henderson writes that there have been wild-fires in Victoria before. But he goes on, “But until now, there has been no suggestion that the state’s future would be one of continuing apocalypse. Yet this is the message of the self-declared progressive media as it seeks to blame others for natural tragedies.”
So what is the view of the self-declared right-wing/denier/septic media? We have had wild-fires before (“natural tragedies” – Henderson) and we will again, and the UN downward pressure will not work because we need “better technologies” (Angus Taylor) – and anyway we will meet our self-designated emissions target “at a canter” (Scott Morrison) and Australia emits a little more than 1% of world carbon emissions (Henderson) so we cannot influence Climate Change.
Anyone questioning the right-wing view is a clown, says Henderson – a comparison also employed by Clive James in his sceptical writing on Climate Change.
Yet it is quite clear, when we look at the graph above and the figures for areas burnt by wild-fires over time, that we are heading for an apocalyptic if we allow those trends to continue. We have been warned by the IPCC for a long time that Climate Change is real, driven in part by the burning of fossil fuels, with now some 30,000 wild-fires burning across the world, global temperatures rising, ice melting, nature adversely affected, people dying from heat effects at a rising rate…
Sceptics try to persuade us that Global Warming is a hoax. But there is no coherent science of denial – just a lot of specious claims, often contradicting each other. For example, Ian Plimer says that CO2 has nothing to do with Climate Change, but the late Bob Carter says CO2 is a greenhouse gas.
Sceptics are often paid by people with vested interests to write as sceptics in order to confuse the climate “debate”. But when we look at the data of the kind provided above, we see the futility of their denial and contrived scepticism. When we read their sceptical writing we see the illogical and contradictory nature of their “arguments”. When we look at the real world we see what the IPCC has been telling us for a long time now.
Wild-fires in Victoria 1896-2010
Like what we do at The AIMN?
You’ll like it even more knowing that your donation will help us to keep up the good fight.
Chuck in a few bucks and see just how far it goes!

19 comments
Login here Register here-
DrakeN -
Josephus -
New England Cocky -
John Boyd -
DrakeN -
guest -
Michael Taylor -
Peter F -
Michael Taylor -
DrakeN -
Regional Elder -
John Boyd -
johno -
New England Cocky -
guest -
wam -
New England Cocky -
guest -
DrakeN
Return to home pageSceptics is a misnomer.
They are denyers, no more and no less.
Their underlying inadequacies prevent them from being sceptical since they cannot admit to the existence of well researched science and analysis for fear of losing their sense of self certainty.
Even my fire fighter neighbour is a denialist. Why would 11000 scientists lie?
Hotter weather. More dry lightning. Rain drops cannot fall to earth as particulate matter breaks them up so they lack weight to fall.
A Welsh village is drowning and its houses fail to sell.
Yet still venial estate agents talk up the meanest seaside shack, and fools will take the bait.
At Canberra’s museum of democracy the annual political cartoon exhibition is on. All are first rate but for me the most poignant is one of a Tuvalu couple wading in knee deep water, as a smirking, sociopathic PM holds up a small bench, saying as he too stands in sea water that he promises a step up to Pacific islanders.
Such mindless cliches are his contributions to their existential predicament.
Perhaps the most effective solution to Gerard Henderson would be to require 24 hour declaration of all political donations to lobby groups listing the directors names of every corporate donation so that AEC investigators could identify all donation splitting as happened with Hal Geneen and IT&T buying Nixon and the Republican Party.
Statistically the graph included at the bottom of this article is meaningless.
Fire fighter denialism seems rampant. Check out the blatantly political ravings in http://volunteerfirefighters.org.au/ .
John, that “association” appears to be as diverse in its membership as the Australian Christian Lobby – a few noisy but highly self opinionated crew lacking in basic scientific understanding.
Have a look at their membership list; lots of repeated names.
New England Cocky,
the graph shows the cumulative area burnt in Victoria between 1896 and 2010. In that time the cumulative area burnt approaches 10Mha. It also shows the rapid increase in burning in the 10 years or so before 2010.
The current fires still burning in Aus now have burnt out 5.9Mha at one stage. Still burning!
How can anybody think this is normal?
‘How can anybody think this is normal?’ Michael, I had a ‘discussion’ half an hour ago with someone who did not know that the PM had refused to meet fire safety leaders as early as May, as well as subsequent attempts by them to meet him.
When I pointed out that she must liven in an information vacuum, the reply was ‘What could he have done?.
What chance?
Had the same with a young check-out girl at Coles the other day. She said; “Why is everyone blaming Scott Morrison? None of this is his fault.” Peter, as was the case that you experienced she was unaware that Morrison had knocked back a meeting with the fire chiefs, but came back with; “I’m not really interested in politics anyway.”
Some people are just plain ignorant.
Michael, that is is reflected in the often heard Sheeple bleat: “Politics doesn’t really affect me.”
Ignorance has no boundaries, yet paradoxically, is often framed by irrational anger against an imagined target group.
Thus, we have many misinformed people in this country who place the Greens Party at the top of their personal or political demonologies.
What has been transpiring in recent months, a drought qualitatively different from others experienced in Australia is the ever incremental influence of anthropogenic climate change, something that has been consistently predicted by scientists for the last 30 years at least.
https://www.theguardian.com/australia-news/2019/nov/17/what-could-i-have-done-the-scientist-who-predicted-the-bushfire-emergency-four-decades-ago?CMP=Share_iOSApp_Other
DrakeN….Tks, I was aware of that but I am a member of the RFS, and was surprised to read in some news item that the Association was speaking for volunteer firepersons.
You would think so, wouldn’t you. Like this abc article, will this be the reason for the LNP to change tack.
https://www.abc.net.au/news/2020-01-06/bushfires-climate-change-opportunity-to-change/11839530
@Anomnyous guest: I am aware of the labelling on the y-axis of the graph, but the graph as a whole is meaningless simply because it is totally irrelevant how much land has been burnt in the past when we are considering the huge area of burnt land in 2019-2020.
OK, being pedantic ….. yes, the 2019-2020 fire season is unprecedented and finally likely to be equivalent to the total area burnt in the period of European settlement. So your point is?? Climate change is real and human induced??
New England Cocky,
thank you for your comment. You have in fact said that the graph is meaningless, but at the same time is meaningful. And out of all that, you say Climate Change is meaningful and human induced. The current fires, as you know, are unprecedented. The graph and the Wiki data emphasize that. The graph gives a dramatic visual presentation of the extent and severity of fires in Victoria over 100+ years.
The purpose of the graph and accompanying article is not to state the obvious or to teach readers to suck eggs. It is first of all to comment on the statements made by Gerard Henderson in the WE Australian, which reflect the usual Murdoch view about Climate Change and which the Murdoch media repeats ad nauseam. Lots of denial published regularly. Even now Murdoch recommends hazard reduction, even when fire chiefs have said it cannot be done over so large an area. But no, the Murdoch scribblers know all about everything and do not listen.
Furthermore, this graph was made 10 years ago. The details of it were known then – that there was dramatic increase in burning in Victoria at the beginning of this century. And warnings about this eventuality were made long before that. Why has it all been ignored by some?
You know all that, but there are many, many people who do not – least of all the devotees of the Murdoch media.
And another little point. The weather events in Oz at present are being driven by the Indian Ocean Dipole, which reduces rainfall. Usually our worst weather events are driven by El Nino, which at present is neutral in the eastern Pacific. When it does return, what can we expect?
thanks for reminding me how silly and old fashioned I am, still tilting at windmills at my age.
I fought the ;jail; with the jenial jiant but the septic lovers were too strong and gaol disappeared from the media.and waited uncomfortably hoping until the bush became a wild fire.
The guest;s
‘Climate Change is meaningful and human induced. is the crux of my tilt with kaye.
There are lovely. honest. hard working deniers who believe in the first part, They are so deeply indoctrinated by their upbringing, their religion and the media into fear of ‘left’ groups that they deny the :and human induced.”
My layman’s understanding is climate change is a constant process over billions of years. During this process carbon has been sequestered as coal and oil. Over the last 299 years a billion white men have been returning this carbon to the atmosphere millions of time faster than nature removed it.QED The balance of nature’s climate change is fcked.
The first step to redress the imbalance is the realisation that the other 6 billion non-white humans cannot get rich on carbon their energy must come from renewables.
The bonus is that the coal and oil may have far greater uses as technology progresses.
But I am just a simpleton sad that the author uses ‘wildfire’ rather than the australian bushfire.
ps
Bushfire or wildfire the auto correct declares one is not acceptable. Gaol is unacceptable as well.
@Anonymous guest (last time). Obviously my statistical training is inadequate because if it is associated with Gerard Henderson then this graph is definitely suspect and remains statistically meaningless rather being a pretty picture to deliberately confuse untrained lay minds. A better representation of the data you claim the graph confers would be a two column graph showing Total Burnt Area on the y-axis with column 1 1788-2010 and column 2 2010-2020.
Uhm … Victoria is a fairly small fraction of the total Australian land area, but I cannot speculate why Victorian residents failed to conduct cool burns.
I think my 40+ years analysing Armidale weather patterns explains Oz weather events … but not here because there is too much detail for a comment.
You have leapt to conclusions. The graph is not “associated ” with Henderson, it is against Henderson who thinks wildfires are simply “natural disasters”.
You could add to your own graph by adding lines representing increase in CO2 and increase in global warming.
Any correlation. You know there is. Henderson denies any correlation. It is the Murdoch way.
If you tempered you ire with a little more attention to what has actually been written, N E C, you might just get a handle on what was actually meant.
Satan exists and Murdoch journalists are merely his demonic assistants.