


A cast of characters: The Monarchy (part 11)
By Dr George Venturini
At mid 2012 a new study had revealed that around 30 million of the British people were to suffer from fuel poverty by the end of the year as the number of households struggling to pay their energy bills was to rise.
According to the report released by the SwitchGasandElectric.com 37 per cent of British consumers were considered as being in fuel poverty and were spending over 10 per cent of their income on gas and electricity bills on average.
The research by the energy price comparison site into the proportion of household income spent on fuel bills in 13,000 homes across the United Kingdom also found a further 13 per cent of Britons would have fallen into fuel poverty had suppliers increase their prices later during the summer. However, the study was in sharp contrast to the statistics published by the United Kingdom Department for Energy and Climate Change – D.E.C.C., predicting that only 3.9 million people in England would have fallen into fuel poverty on 2012.
“What the government data does not reveal is the huge number of Britons who are already forced to spend more than a tenth of their income on gas and electricity bills,” said the managing director of SwitchGasandElectric.com. “With that figure only set to rise, and with food bills and living expenses escalating too, most Britons are going to see their finances severely squeezed even further this winter,” she added.
Earlier in March 2012 a report had warned that, due to rising energy prices and costly green taxes in Britain, the number of English households struggling to pay their fuel bills would have risen to 9.2 million by 2016.
The Hills Fuel Poverty Review which was carried out by Professor John Hills, a London School of Economics academic who was assigned in 2011 by the D.E.C.C. to examine the issue of fuel poverty, also found that under the current definition of fuel poverty, around 4 million of the total of 21.5 million households in England were struggling to pay their bills. (M. McGagh, ‘A fifth of UK pensioners at risk of poverty – A poverty league table has ranked the UK 10th-highest in the EU for the number of people at risk of poverty’, 13 June 2012, citywire.co.uk).
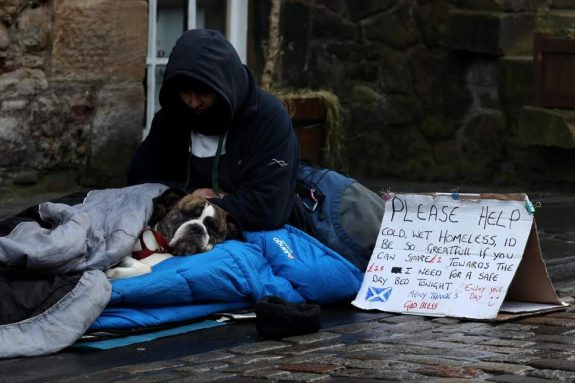
What precedes is a brutal portrait of Britain’s socio-economic condition in 2012. It was Gandhi who said that a society is judged by how it treats its weak and its frail. By that judgement Britain was fairing very poorly indeed.
Figures released at mid-June 2012 showed that a quarter of people living below the poverty line came from households where all the adults were working. In the United Kingdom there were five unemployed people chasing every job vacancy, yet those lucky enough to get a job had no guarantee of working their way out of poverty. The job they could get was likely to be temporary, precarious and hard. Whilst people were told by business leaders that labour inflexibility was the problem in the United Kingdom, in fact those in work have less protection than in Mexico.
Yet the richest in society were getting a lot richer, and very quickly indeed.
The most important message conveyed by Perfect storm was that so much misery is not unavoidable, but is instead the result of political choices: the government had chosen to tip the balance of deficit reduction towards spending cuts – up to 77 per cent – instead of taxation.
And, speaking of taxation, it was well known that illegal tax evasion and unacceptable tax avoidance were costing Britain £35 billion in 2011. To put it in context, here is what that amount of money could have bought:
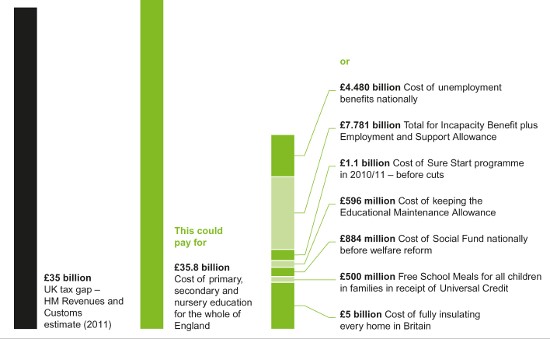
This was a clear indication of the stark inequality which had plagued Britain for a long time – and not since the global financial crisis of 2008. That inequality – Oxfam observed – had reached almost Victorian levels. The proof was soberly given in two figures: average earning down by 4.4 per cent in 2011, C.E.O.’s remuneration up by 49 per cent in 2012. (J. Martino, ‘We need to keep talking about inequality in Britain’, 15 June 2012, oxfam.org.uk).
Being poor in Britain in 2012 was brutal.
So let us keep talking about inequality in Britain, urged Oxfam. Most newspapers were writing about it – the Independent, the Guardian, the Telegraph, the Evening Standard, the Financial Times, and the Daily Mail, among others. Perhaps none ever reaches the Palace ?
The Joseph Rowntree Foundation returned to the subject of poverty in the United Kingdom in a recent report to assess the progress the country was making in reducing poverty rates and tackling the underlying drivers of poverty since the publication of the Foundation’s Strategy to Solve Poverty in 2016. The December 2017 report examines how poverty had changed over the last twenty years, as well as more recent developments.
The report noted that over the past 20 years the United Kingdom has seen very significant falls in poverty among children and pensioners. Twenty years ago a third of children lived in poverty; this fell to 27 per cent in 2011-12. In 1994-95, 28 per cent of pensioners lived in poverty, falling to 13 per cent in 2011-12. However, such progress was now at risk of reversing because poverty rates for both groups had started to rise again, to 30 per cent for children and 16 per cent for pensioners.
Three factors had led to falling poverty: increased support through benefits and tax credits; rising employment; and containing the impact of rising rents through housing benefit and increased home ownership. All such gains were now under question: 1) The continued rise in employment was no longer reducing poverty; 2) State support for low-income families through benefits and tax credits was falling in real terms; 3) Rising rents, less help for low-income renters and falling home ownership left more people struggling to meet the cost of housing.
The research examined trends in poverty over the previous twenty years. It presented analysis of the main factors driving these trends, including changes in employment, skills and pay and state support for working-age families and pensioners.
The report also explored aspects of life which are closely linked to poverty – the quality and security of housing, mental and physical health and relationships within families and more widely. Finally, it examines trends in factors which had a strong impact on the prospects of future poverty: education and financial resilience.
The report made some key points, in addition to what was said about poverty among children and pensioners.
Most importantly, poverty among children and pensioners has risen in the previous few years: 30 per cent of children and 16 per cent of pensioners now lived in poverty.
In addition, in 2017:
1) One in eight workers – 3.7 million – lived in poverty.
2) 47 per cent of working-age adults on low incomes spent more than a third of their income (including Housing Benefit) on housing costs. More than a third of working-age adults presently receiving Housing Benefit needed to top it up out of their other income to cover their rent.
3) 30 per cent of people living in a family with a disabled member live in poverty, compared to 19 per cent of those who do not.
4) Nearly a quarter of adults in the poorest fifth of the population experienced depression or anxiety.
5) More than one in 10 working-age adults in the poorest two fifths, and around one in six pensioners in the poorest fifth, were socially isolated.
6) 20 per cent of those in the poorest fifth had ‘problem debt’.
7) 70 per cent of people in work were not contributing to a pension.
Poverty rates were consistently highest among children and their parents. The groups with highest poverty were lone parent families and families with three or more children. Poverty rates fell significantly for these groups over the previous twenty years. In 1994-95, 58 per cent of lone parents lived in poverty, falling to 41 per cent in 2010-11 before rising again to 46 per cent in 2015/16. In 1994-95, 45 per cent of children in families with three or more children lived in poverty, falling to 32 per cent by 2012-13 before rising again to 39 per cent in 2015-16. Poverty among families with children was rising, largely due to reductions in the support offered by benefits and tax credits. Tax cuts and minimum wage rises were beneficial for some, but for many low-income families the gains were far outweighed by reductions in the more targeted support given by the benefit and tax credit system. 3.7 million workers lived in poverty. Of the 12 million working-age adults and children in poverty, 8 million lived in families where at least one person was in work.
Poverty rates among couples without children had always been low and had changed very little with around one in ten in poverty throughout. Levels of poverty among single people without children had also been fairly steady – around a quarter were in poverty in 1994-95, rising to 28 per cent in 2009-10 and falling back to a quarter by 2015-16.
Increasing costs for essential goods and services had exacerbated the financial pressures faced by families on low incomes. 47 per cent of working-age adults in the poorest fifth of the population were now spend more than a third of their income (including Housing Benefit) on housing costs – up from 39 per cent in 1994-95.
Since 2003 overall inflation had been higher for people on low incomes than for those who are better off.
With particular regard to pensioner poverty, the report observed that in 1994-95 pensioners had the highest rates of poverty in the United Kingdom apart from children. Nearly three in ten pensioners lived in poverty; by 2011-12, this had fallen to only 13 per cent, driven mainly by falls in poverty among single pensioners. More recently, however, pensioner poverty had started to increase again, reaching 16% in 2015-16.
The main falls in the pensioner poverty rate happened among single pensioners between 1998-99 to 2004-05. This was driven by increased state support for low-income pensioners through the Pension Credit Guarantee (previously the Minimum Income Guarantee) and rising home ownership which reduced the proportion having to meet rising rents. In the previous few years these drivers had become weaker.
The Pension Credit Guarantee had failed to keep up with prices. Housing costs for those pensioners still renting had risen.
With reference to housing, health and relationships, the report noted that the proportion of homes which do not meet minimum standards of covering safety, state of repair, facilities and thermal comfort has fallen over time but those on low incomes remained more likely to live in these houses than those who were better off. In England, just over one in five of people in the poorest fifth of the population lived in homes considered as ‘non-decent’.
Disability was strongly linked to poverty – 30 per cent of people in families with disabled members lived in poverty, compared to 19 per cent of those who did not. More broadly, adults in the poorest fifth of the population experienced worse physical and mental health than those who were better off. Nearly a quarter of adults in the poorest fifth of the population experienced depression and anxiety – more than twice as many as those in the richest two fifths of the population. The proportion of those in the poorest fifth in England experiencing these mental health conditions had also increased over time.
More than one in ten of working-age adults in the poorest two fifths of the population were socially isolated, compared to just over one in 20 of those in the richest fifth. Around one in six of the poorest fifth of pensioners were socially isolated, compared to only around one in 14 in the richest fifth.
Children in lower-income families were more likely to report that they quarrel with their parents and do not discuss important issues with them. The proportion of couples experiencing ‘relationship distress’ was higher in the poorest fifth of the population and decreased as incomes rise: just under one in ten of those in the poorest fifth, compared to around one in 20 of those in the richest fifth. Couples who were on low incomes were more likely to separate than those who are better off.
As to education and skills, the J.R.F. report said that in England and Northern Ireland at age 16 young people from poorer backgrounds were around a third less likely to achieve good qualifications than better-off students. In Wales they were about half as likely and in Scotland a fifth less likely.
Since 1996 there had been a large decrease in the proportion of working-age people with no qualifications and an increase in the proportion with higher education and degree level qualifications.
By 2016 less than one in 10 working-age adults in England, Scotland and Wales had no qualifications, a reduction of more than half. Wales had caught up with England and Scotland by this time, having begun with a higher proportion of adults with no qualifications. Northern Ireland stood out as having the highest proportion of adults with no qualification – 30 per cent – in 1996, and still having a much higher proportion in 2016 – 16 per cent, despite a reduction of nearly half.
Since 1996 the proportion of working-age adults with higher education qualifications had nearly doubled in England, Scotland and Wales; 45 per cent of working age adults in Scotland, 38 per cent in England and 35 per cent in Wales had these qualifications. In Northern Ireland the proportion with higher education qualifications was the lowest in 1996 – at 17 per cent – and remained the lowest in 2016 – at 31 per cent.
As far as debt and pension accumulation were concerned, 20 per cent of those in the poorest fifth reported having ‘problem debt’, compared to 11 per cent of the second poorest fifth and just 1 per cent of those in the richest fifth.
Only 30 per cent of people in work in the poorest fifth of the population were contributing to a pension scheme, compared to 67% of those in the richest fifth.
The report concluded that:
1) The prospects for solving United Kingdom poverty were worrying.
2) The continuing rise in employment was no longer leading to lower poverty.
3) Changes to benefits and tax credits for working-age families were reducing the incomes of many of those on low incomes.
4) High housing costs continued to reduce the incomes available for those in poverty to meet other needs.
5) Inflation was rising and was higher for those on lower incomes than for better-off groups.
6) This squeeze on living standards was also storing up problems for the future, such as:
- a) a fifth of people on low incomes would have encountered ‘problem debt’; b) most were not building up a pension;
- c) the decreasing proportion of the working-age population buying their own home meant that in the future more older people were likely to rent and have higher housing costs in retirement.
The United Kingdom had seen considerable success in improving skills and increasing employment. However, the majority of young people from disadvantaged backgrounds still do not achieve five good points in the General Certificate of Secondary Education, generally taken in a number of subjects by pupils in secondary education in England and Wales over two years. There was still a group of adults with no or low qualifications who were at an increasing disadvantage in the labour market. Part-time workers were particularly vulnerable to poverty, with a poverty rate more than twice as high as full-time workers, and qualifications were far less effective in improving their pay prospects than for full-time workers.
The impact of poverty on physical and mental health and on relationships within families add to the disadvantages facing those living on low incomes. Enabling those in poverty to improve their incomes and reduce their costs, as well as addressing the negative impacts of low incomes, would help to prevent future poverty. (www.jrf.org.uk, H. Barnard (leader of the J.R.F. Analysis Unit), UK Poverty 2017, J.R.F., 4 December 2017, pdf; for a recent examination of some of the problems, see G. Peebles, ‘Britain’s homeless crisis’, 14 December 2018, counterpunch.org).
Continued Saturday – A cast of characters: The Monarchy (part 12)
Previous instalment – A cast of characters: The Monarchy (part 10)
 Dr. Venturino Giorgio Venturini devoted some seventy years to study, practice, teach, write and administer law at different places in four continents. He may be reached at George.venturini@bigpond.com.au.
Like what we do at The AIMN?
You’ll like it even more knowing that your donation will help us to keep up the good fight.
Chuck in a few bucks and see just how far it goes!

4 comments
Login here Register here-
Karen Kyle
-
Graeme Taylor
-
Phil
-
Michael Taylor
Return to home pageFunny, I thought all this poverty and income inequality was caused by the inherent evils of Capitaliam and neo Lib economics. I didn’t realise the Monarchy is largely to blame, given that the Monarchy is largely self funded through the income generated by the Royal Estate. The Queen gets twenty five per cent of this income and the rest goes to the British Government.
This writer has a problem with the idea that the UK is a Constitutional Monarchy. So what? Is it any skin off his nose? Most Brits support it,so jolly good luck to them. It is not the business of anyone else.
Unlike the UK Australia does not need the Monarchy especially, and we might have been a Republic by now if the idiots running the Referendum had not asked the wrong question.,
One is left to wonder how much money the Monarch receives from her estates called Australia, Canada and New Zealand.
When setting up these estates as self governing colonies, what arrangements were put in place to ensure that any revenue accrued by the Monarch would be secret?
Since any relevant official who may have inside information on this, is required to swear or affirm allegiance, as a job requirement, their denials and talk of the “Australian Crown” being independent of the Crown of Great Britain need to be taken as a diversion.
When the Royal metals, Gold and Silver are extracted from Australia, where to the Royalties end up?
As for the Royal family not being anyone else’s business but the Brits. I beg to differ. When these free loaders hit our shores, my taxes pay for their security and upkeep whilst they’re cutting ribbons and other Royal duties like, their perusal of the stock market, checking their shares in Rio Tinto the Queen is a major shareholder I believe. The Brits can’t afford the luxury of this anachronistic clap trap. What was it the Queen said? Oh yes I remember ‘ When the toxicity of a republic comes, we will go gracefully ‘ Well when you go Betty don’t let the draw bridge hit you in the arse on the way out. Btw sought out the Crown Jewels and return them to their rightful owners.
Graeme, I’m fairly sure that’s covered in the next few instalments. The net worth of the Royal Family will make your eyes water.
Phil, when in Edinburgh – whilst always staying nearby – I refuse to go to Hollyrood Palace. Why? Because it’s the Queen’s Edinburgh residence and they have the nerve to charge money to enter. Same as the Royal Yacht Britannia – which now resides at the Leith docks in Edinburgh. They want £18 to go onboard! I don’t want to look at the opulence they enjoyed while there’s so much poverty in the UK.