Let’s keep Australia working

By John Haly
The Liberals who cut penalty rates, public services, and taxes for the corporates, have come up with a slogan to replace “Jobs and Growth”. The slogan is, “Let’s Keep Australia Working.”
The implication being a vote for Labor is a vote against your job. The question we need to ask is: “Has the liberal agenda succeeded in keeping Australia working or are jobs and wages diminishing?”
Full-time / Part-time
In October 2017, Michaelia Cash promoted job growth as she claimed “371,500 jobs created over the last year, 315,900 were full time“. Referencing the ABS’s next month’s stats, Malcolm Turnbull later said: “New data shows another 61,600 jobs were created in November, lifting the number of new jobs this year to 383,300.” That may sound convincing and consistent. Of course, as other authors such as Alan Austin note, it is all a matter of strategically timing your announcement, so the figures fit your case. For example, choosing a month where historically low employment featured the previous year to be compared with a better statistic this year. A slightly different choice of month or period produces different results. Statistical variations depend on the accuracy of the collection methods; underlying definitions of employment, and what dates are being compared. The ABS statistical methods for employment issues have come under considerable criticism even from within its ranks. The ABS, although, does not engage in any statistical tampering or deception on behalf of the government. ABS methodology follows the ILO international protocols for measuring unemployment, although the methodology does have its faults.
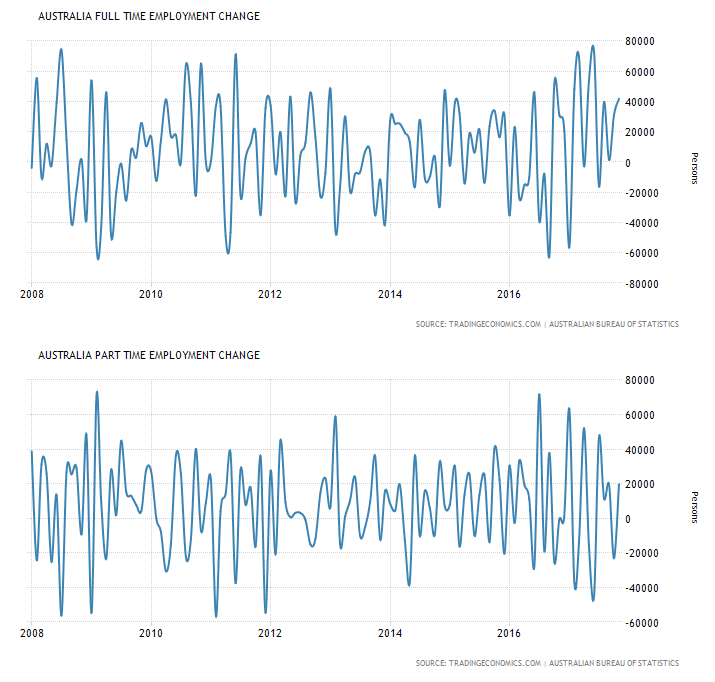
Highly changeable variations in part and full-time employment
Monthly deviations in Full-time employment and part-time employment are significant, and cherry picking dates can be misleading. Depending on what is your starting and ending point you can show either rising or falling employment. What is notable is the increasing volatility of employment markets over the years.
So are there alternative measures which use alternative criteria for measuring employment? Roy Morgan’s measurements are considerably more modest than the ABS stats that Michaelia Cash and Malcolm Turnbull referenced. Their numbers for November 2017 report show long-term job expansion is in part-time jobs, with declining full-time jobs. The figures provided, show that full-time employment decreased 31,000 in the last year till November whereas part-time employment rose by 70,000.
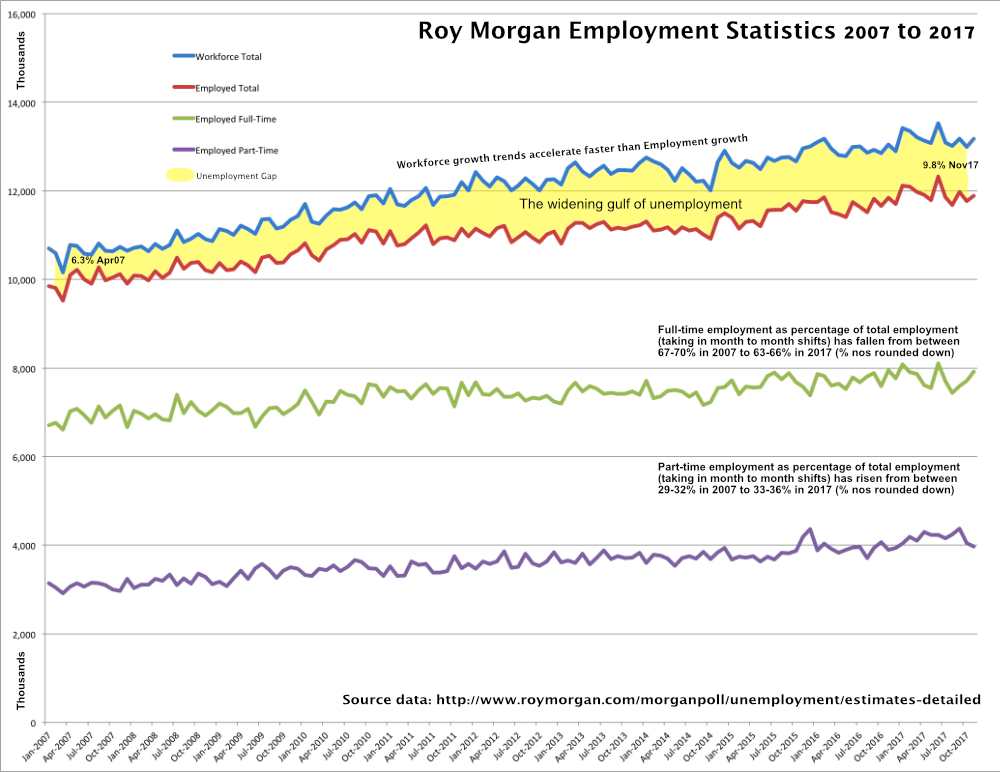
Charting Roy Morgan’s analysis of employment and unemployment from 2007 to 2017.
Roy Morgan’s measurements for employment and unemployment differ considerably to the ABS’s methodology for a few fundamental reasons. Morgan’s take on part-time and full-time employment also depicts it as volatile. Morgan shows that part-time employment is growing faster than full-time as the job market is becoming increasingly casualised. A point with which even the RBA agrees. Graphing these statistics over the last ten year shows a clear trend which the ABS methodology obscures while Roy Morgan’s method makes it easier to track. This methodology is also notable for tracking under-employment, or what the ABS calls “hidden unemployment”.
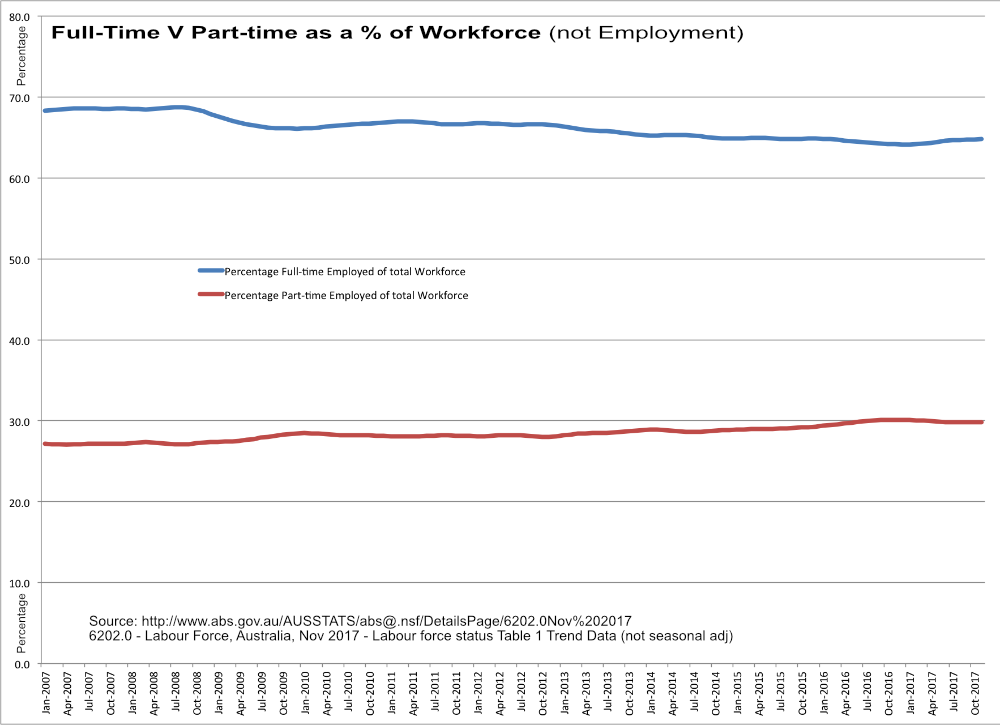
Falling Full-Time V Rising Part-time as a % of the Workforce
Employment numbers have risen, but so has the total labour workforce seeking or occupying employment. The problem is that unemployment and underemployment according to Roy Morgan’s stats were 2.394 million people in Nov 2017 (18.2%). Combined underemployment and unemployment haven’t been consistently below 2 million since 2011. One has to dig through ABS’s statistics for their underutilisation figures to see a similar pattern. Roy Morgan reports 9.8% unemployment, and for ABS it is 5.4% in November 2017. Using percentage figures in a growing labour force can be inherently deceptive. According to the ABS, our unemployment rate in Nov 2017 is at 5.4%, and the last time it was that rate was in February 2013. But in February 2013, that represented 660,000 people. By November 2017 5.4% is 708,000 people. Taking Roy Morgan’s unemployment figures for Nov 2017, we have 9.8% or 1,288,000 people. The last time we were at 9.8% in a similar period to ABS’s 2013 figure, was August 2012, where 9.8% represented 1,205,000 people. In essence, 5.4% or 9.8% in 2017 isn’t equivalent to 5.4% or 9.8% in late 2012/early 2013. Whichever statistical methodology you reference, our labour market is worse off regarding raw unemployment numbers, casualisation, and volatility than we were under Labor’s administration.
Working Hours
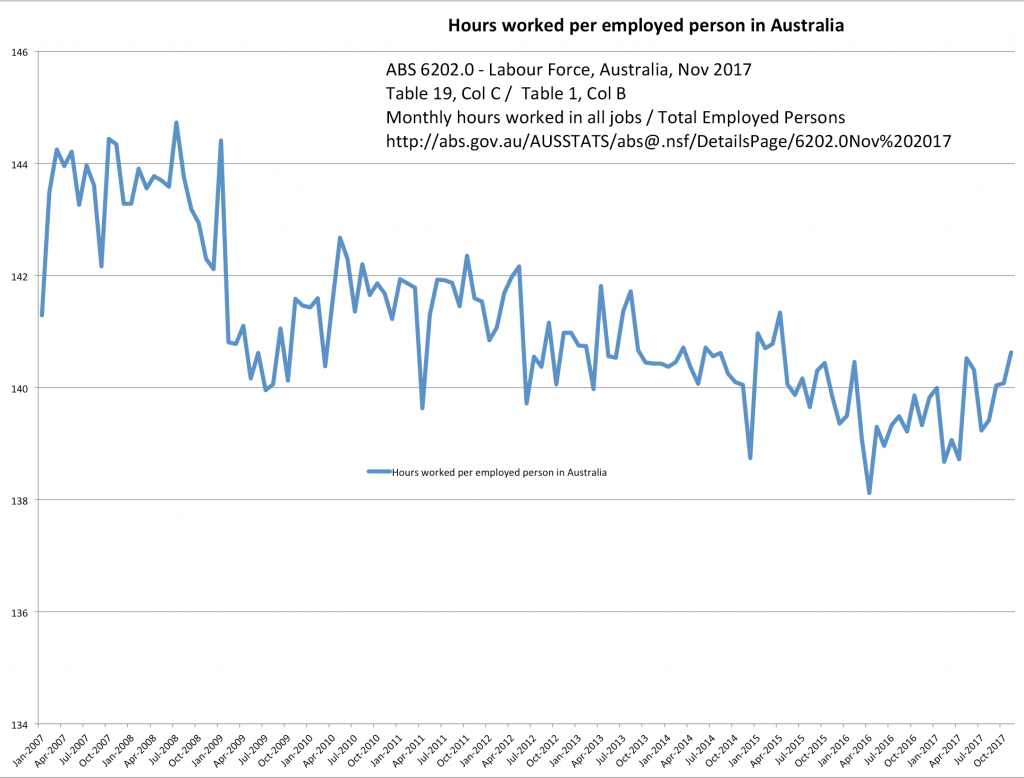
Hours of work available for the employed market
But what about the hours worked by those who are employed? It would seem self-evident that if part-time work was rising faster than full-time, that hours worked would be reducing. It has long been the thesis of writers such as Alan Austin. I took a slightly different track with ABS data and charted hours worked as a function of just those employed, rather than demonstrating as Alan does, that working hours available for the Adult population is decreasing. In spite of how you look at it, it is evident that adequate working hours are less accessible both to employed and unemployed.
Job Vacancies
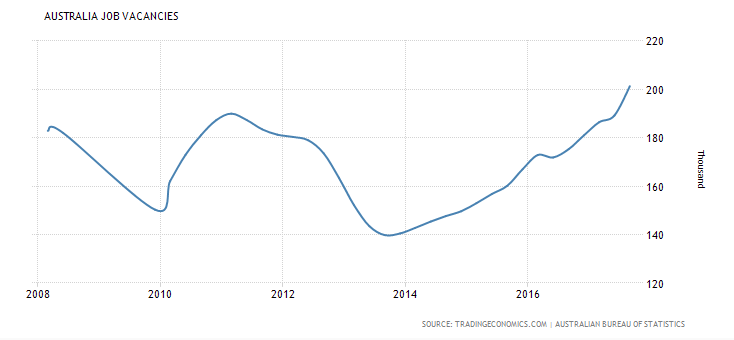
10 years of job vacancy numbers for Australia
Job vacancies in comparison to unemployed job seekers have also been problematic. While there has been a soft rise in vacancies available over time – since the coalition came into power – it has been far below any measure of unemployed numbers (no matter the method). The job vacancy rate for the entire continent of Australia from the government’s IVI index for November 2017 was 177,900. In the four years of the coalition government, it has never risen above 180K and has been as low as 150K. Now to be fair, not all vacancies (although most) advertise online. The ANZ, although, regularly tracks job advertisements saying “Job ads growth was 3.7 percent year-on-year in December, a steep fall from 6 percent in November. In trend terms, the numbers looked a bit better at 4.7 percent year-on-year, but this was down sharply from 9.4 percent annual growth in early 2016.” So let’s factor in these adjustments. Fortunately, Trading Economics has already done this, reporting “Job Vacancies in Australia increased to 201.30 Thousand in the third quarter of 2017 from 189.20 Thousand in the second quarter of 2017“. Despite the increase, 201K job vacancies hardly make a dent in 1,288,000 unemployed people let alone 2.394 million under-employed and unemployed persons seeking jobs in Australia.
Wages
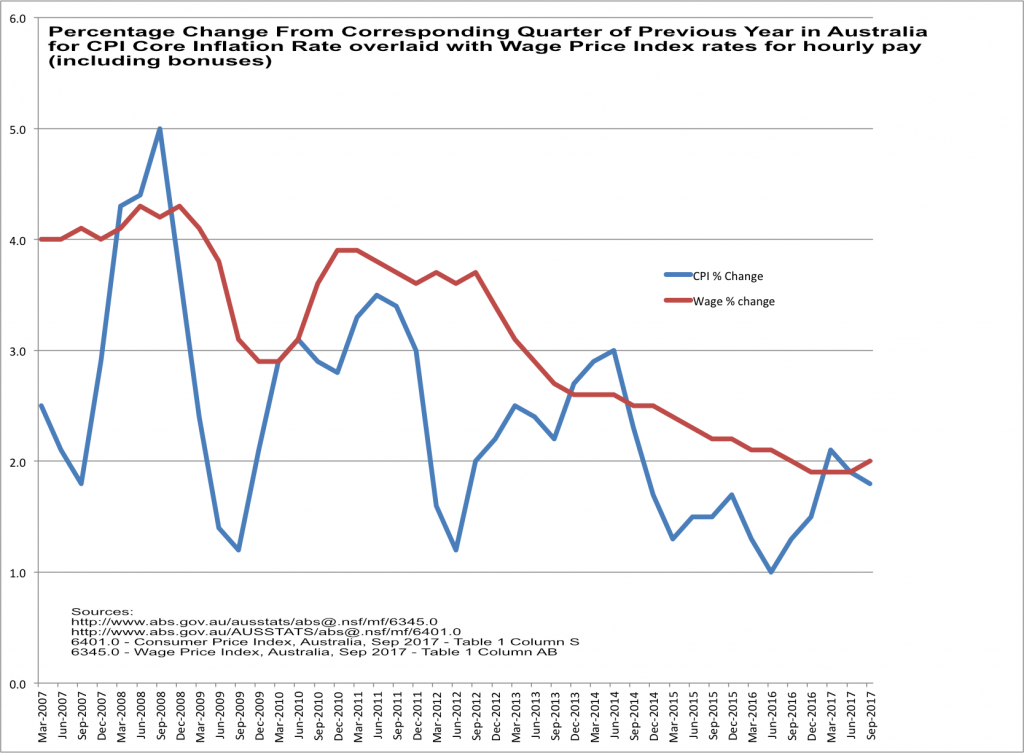
Wage rates treading water over CPI rate increases
Well, at least the employed get paid, you may – in the resignation of these dismal statistics – sigh. Therein the news gets worse. Wage rate growth continues to stagnate, to levels unseen in this century down as far as 1.9% in the previous quarter. While there is still growth, the question needs to be: Is the growth rate keeping up with that of the CPI? The answer on the surface is “barely”. ABS statistics graphed here show that it is predominately keeping its head above water. The CPI is widely criticised for “excluding home purchase costs“. In a country where private debt towers over GDP by 122% and housing affordability limits access to homes, this is a significant omission. “The ABS does produce cost of living indices which consider the cost of living according to your source of income – wage, pension, or government benefits“, states the Guardian’s Greg Jericho. Once you add the real cost of living factors, you will quickly realise wages are not keeping up with the actual costs of living.
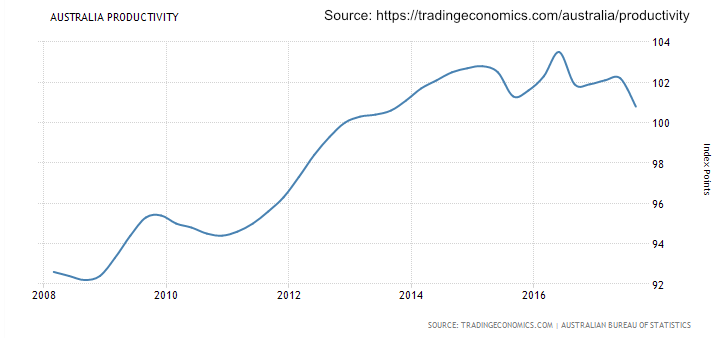
Australia’s rising productivity
Despite the falling wage growth rates, productivity has been expanding by all indicators. One would assume if the nation is being more productive that wages should rise accordingly. So the claim by the Prime Minister has turned from claiming the lack of wage movement is a function of a lack of security and productivity to being “blamed [for] a lack of economic demand“, despite later boasting about Australia’s economic growth. It would appear the government’s excuses change from month to month and assume nobody is keeping track. So despite fewer hours available collectively for the employed, and reducing wage rises, the level of productivity in the country has been rising.
Job Losses
Job losses for specific industries under the instigation of the coalition will have long-term consequences for our economy. Some of these include:
- Abbott and Hockey’s dismantling of the car manufacturing industry in this country for a preference for imports from China, Korea and Japan saw the end of jobs for thousands of workers with estimates from 90K to 200K losses. Hockey had admitted in Parliament that “Ending the age of entitlement for the industry was a hard decision, but it needed to be made because as a result of that decision we were able to get free-trade agreements with Korea, Japan and China.’’
- The government continues to seek means to support a diminishing mining industry and supply $1billion to Adani Mine. Mining employment is contracting, but it is being promoted at the cost of a tourism industry that employs more than twice the number of people. The tourism sector has the more significant potential for job creation than the mining sector.
- The coalition has overseen one in ten public servants losing their jobs, while spending on consultants has risen by $300 million. Amongst those civil servants, the tax department has divested itself of 4400 employees and their expertise in keeping tax avoidance in check, so private companies could stash money overseas whether acquired via profits or tax cuts rather than use it to employ more people in Australia.
Foreign Workers
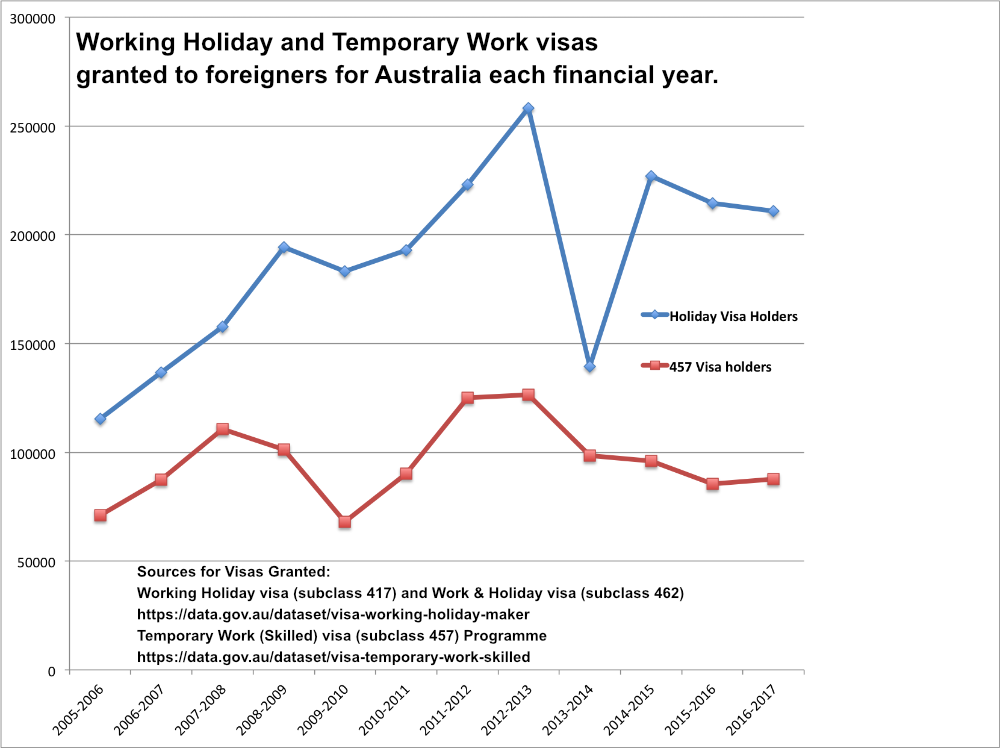
Numbers granted the predominant classes of working visas for Australia.
There are 37 Visa sub-classes available for a foreigner to work under in Australia of which the 457 sub-class received significant notoriety. As at the end of 2016, there were 95,758 people in Australia who had that visa. That sub-class is being replaced by two separate classes – as announced in April of 2017 – for the future, so tracking worker visas will ultimately be more complex from here on in. Consequently, as a result, the 457 class numbers will naturally begin to shrink which will no doubt be a talking point for the government from hereon.
The lessor referenced 417 and 462 Class of working holidaymakers has had 63,988 visitors granted with working rights last year up until September of 2017. Mapping these three visa classes over the last decade gives one a perspective of for whom the government focusses on “keeping working”.
Now to be fair even if all these people left tomorrow it would still not have a significant impact on unemployment and not simply because the numbers are “low” relative to the numbers of unemployed. As usual, it is nuanced, and for a greater understanding, I have written on this at greater length here.
Conclusion
It is, although, evident that the claims by politicians about their success in managing an economy that has produced employment is highly subjective and lacks credibility. Whatever the coalition is doing, it is NOT keeping Australia working.
This article was originally published on Australia Awaken and Independent Australia.


15 comments
Login here Register here-
Topenda -
John Haly -
Glenn Barry -
jimhaz -
Jack Straw -
Topenda -
John Haly -
John Haly -
Alan Luchetti -
David Stakes -
Terry2 -
Kaye Lee -
John Haly -
Rob -
Leah or the Cow Who Jumped Over the Moon
Return to home pageSomething that may not be taken into account by the casual reader is the methodology behind coming up with job vacancy figures. “The IVI is based on a count of online job advertisements newly lodged on SEEK, CareerOne and Australian JobSearch during the month.” (http://lmip.gov.au/default.aspx?LMIP/GainInsights/Vacancy Report)
I’m often sceptical of “available” job numbers as in my observation most jobs are advertised online on multiple websites. The methodology apparently acknowledges that – see above link – although of course it’s misrepresentation to claim the resultant figure represents the total number of genuine job openings. If I advertise the same job on two sites four times each in a month, I can hardly claim to have eight jobs available.
Another thing that may skew figures is the dodgy ‘work from home’ and ‘business opportunities’ that are often found in job ads. These can hardly be claimed to be genuine opportunities for the average unemployed person. Also, let’s not forget the numerous commission only ‘jobs’ that are unlikely to be a viable proposition for the average person, (and none of the above would be likely to be counted as ‘real’ jobs by the job service agencies).
While announcements about job figures regularly mention many jobs are not advertised, I’ve never seen one yet that mentions the above issues.
Topenda,
Being aware of the issues around measuring vacancies I added in the ANZ’s percentages (mentioned in the article) and found that Trading economics numbers were larger still. I decided on using that graph because it seemed to depict the largest numbers representative of vacancies, so that even the most conservative commentators could suggest I was not being fair in my appraisal.
The IVI is an approximation of the main stream of jobs people look for but you are right to suggest lacks some accuracy. It does although demonstrate statistically that the vacancies available do not even begin to provide for the numbers of unemployed, much less the underemployed.
@John Haly you wrote ” I decided on using that graph because it seemed to depict the largest numbers representative of vacancies, so that even the most conservative commentators could suggest I was not being fair in my appraisal.”
I believe you meant – I decided on using that graph because it seemed to depict the largest numbers representative of vacancies, so that even the most conservative commentators could not suggest I was not being fair in my appraisal.
Good analysis with an adequate timespan to show significant trends.
It is somewhat distressing that with the passing of the GFC into a period of alleged healthy growth in the global economy, virtually every metric of our domestic economic performance shows deterioration under the LNP.
I know there are the repeated promises by Morrison about better days ahead – they have been in the same category as “tomorrow never comes” since he first uttered them.
I ponder if the LNP were left to denigrate the entire country to the extent of their ambition – what would they do once they had achieved that outcome – the possibility of hoovering up everyone living in poverty and exporting them to a penal colony is no longer there…or is it, perhaps the true value of Manus and Nauru.
As Australia moves more and more away from manufacturing to services one would think that growth would have also occurred in government services, thus government employment.
Also it would not surprise me to see countries like China move faster and faster into those service areas in which we currently export, taking away job opportunities for the non-elite.
We have the governments trying to export certain government services to India and setting up within Australia shared service centres staffed primarily by recent immigrants from India and the Philippines. Such activities greatly help the growth of export services in those countries and there are a billion people in our region who will gladly work for lower wages.
Services industries generally find it far, far easier to shift large numbers of staff people from full time to casual and part time work or self employment and agency based work that completely lacks security, including the security of consistent hours of work. Casual and part time workers have little to no power, leading to abuses and wage gouging by employers – hence the decline in the distribution of productivity profits and the loss of conditions such as pre-scheduled shift work.
If we produce nothing and lose export services to developing countries – which would include the foreign investment in things like tourist resorts which will only increase under the current neocon pseudo-regulation regime – Australia will end up being dependent on our own overseas investments. Such investments are generally held by the most wealthy (80/20) and this means we will become even more token to their demands.
The Reserve Bank own charter; especially Objectives of Monetary Policy ; seem to have buried sections B and C in the bottom draw.
Objectives of Monetary Policy
The framework for the operation of monetary policy is set out in the Reserve Bank Act 1959 which requires the Board to conduct monetary policy in a way that, in the Board’s opinion, will best contribute to the objectives of:
A,the stability of the currency of Australia;
B,the maintenance of full employment in Australia; and
C,the economic prosperity and welfare of the people of Australia.
Thanks for the further info, John; I understand the approach of erring on the side of caution. My comment wasn’t meant to be a criticism – more an observation that the average person takes the figures at face value, which gives a rosier impression of the situation.
Of course, you’re right – no matter how rosy they look, jobs available are by far insufficient to take up willing and available work capacity.
Yes, thank you Glenn Barry, I meant what you said. I got my double negatives mixed up. My apologies, but I gather you all understood what I meant, as opposed to what I wrote on an IPhone while trying to get my son enrolled in a course at the Powerhouse. I was distracted. Not an ideal place for a journalist to write in.
Topenda, I didn’t assume your comment was a criticism but sought to elaborate further. Thank you for your input. These are important understanding to have. I did spend some time covering the limitations of statistical methodology in the article, so it was fine to expand on that.
Jack, at low interest rates monetary policy loses what limited traction it has in more normal economic climates. The RBA has done all it can to counteract the Libs’ abysmal fiscal policy. Its Governors have pleaded (politely and obliquely as they must) for the Libs to invest in more infrastructure and to stop suppressing economic demand by squeezing welfare recipients and low and middle income earners.
A Statisticians dream is all of this, You can bend it in all sorts of ways. Bet if you stood on a street corner in Suburbia and asked people. You will get the real answer..
I caught up with two young family friends over Christmas, both in their twenties and both in full time employment but both in some sort of permanent casual job situation.
Jobs they have held for over twelve months and in both cases their hours are governed by demand and with fluctuating, irregular hours of work they are frustrated that they cannot borrow for housing and find it hard to budget for rent and other demands on their income.
And, of course they do not receive paid sick leave or holiday pay or superannuation.
This generation of young people will not tolerate this level of exploitation and they will demand a fair go : beware if we do not offer them hope, they will rebel !
Terry,
They should still be paid superannuation for any month they earn over $450.
David, It is correct to say the people in suburbia might say the same or they might speak – as some do – about how quickly they or their friends got jobs. That is referred to as anecdotal evidence and without a broader scope of statistics and evidence gathering the suburbanites or the “blokes down the pub” can make the tale go either way. Trust me they do, as I have discovered from folk who argue with me they have never had a problem getting a job and accusing others of being bludgers. Nationwide statistics don’t mean it is harder or easier for individuals in their small circle of a community to find or keep work. The problem only manifests when you look at the broader picture, and you see that for every bloke how lands a job at the first interview there are – on average – another 15 in other small communities who have remained unemployed long term. So it all depends on which corner of which suburbia you ask, as to what answer you get. BUT if you go to enough corners over several suburbias a pattern emerges. Statistics is that process. I know it is easy to disparage methodologies, and I certainly have herein, which is why I have looked at more than one statistic gathering group to try to reveal a pattern. Don’t be too dismissive of statistics. The anecdotal stories have their place, but sometimes they hide rather than tell the truth.
A good article, thank you. A few too many graphs for my liking, even though the trends are not good and farmer Cash’s cherry picking are a very real problem. I worked on the U/E Stats many years ago. Was and still am baffled by the number of categories for work, be they part time or full time to completely unemployed and not on an approved activity or ‘training course’ of some description. IE: A job active (in-house) resume writing course (See also contact hours $ for your job active provider)
Seek.com et al have some dubious, no many dubious job adverts (vacancies) from the main stream job agencies. “Fishing trips’ or resume collecting. Many non-descript jobs out there, send your resume/ CV to the contact person. “You didn’t get the job and we wish you all the best with your future endeavours,” Listen to any message on hold with mainstream recruiters its mainly all about the employers (clients0 NOT about the job hunters (candidates) Trying to get in touch with the contact person isn’t easy, they are always ‘out’ “Can I take a message and Mr / Miss X will call you back?”
job active are no better, arrogant, lacking in labour market knowledge, local or national. Always right and never wrong. only now Malcolm and the newly departed alan tudge & bff christian porter have ceeded centrelink powers of benefit cancellation to the trigger happy, cash strapped, profit orientated Job active providers.
Between you and me, the jobs mainly, contract i had were of my own making. JA did bugger all except annoy, cajole and incite. special agent dutton must have something to do with them as well??
The extreme right LNP, don’t care. They desperately want our votes, they so desperately want to WIN as these born to rule types always do. The ABS do massage the U/E Stats, their graphs tell no lies, only the politicians wanting our vote do !
It seems to me that this situation is the inevitable result of the zeitgeist described by Sharon Beder in her book Selling the Work Ethic, and in the case of Amerika by Curtis White in his various books, especially The Spirit of Disobedience and The Barbaric Heart. The two words barbaric heart are a perfect description of right-wing politics in the USA, and increasingly so here in the make-believe-land of OZ.