


A cast of characters: The Monarchy (part 7)
By Dr George Venturini
Poverty is defined by the British government as ‘household income below 60 per cent of median income’. The median is the income earned by the household in the middle of the income distribution.
In the year 2004-2005 the 60 per cent threshold was worth 183 pounds (AU$273, then) per week for a two adult household, 100 pounds (AU$150, then) per week for a single adult, 268 pounds (AU$400, then) per week for two adults living with two children, and 186 pounds (AU$278, then) per week for a single adult living with two children. This sum of money is after income tax and national insurance have been deducted from earnings and after council tax, rent, mortgage and water charges have been paid. It is therefore what a household has available to spend on everything else it needs.
One should consider also that there are basically three current definitions of poverty in common usage: absolute poverty, relative poverty and social exclusion. ‘Absolute poverty’ is defined as the lack of sufficient resources with which to keep body and soul together. ‘Relative poverty’ defines income or resources in relation to the average. It is concerned with the absence of the material needs to participate fully in accepted daily life. ‘Social exclusion’ is a new term used by the British government. Prime Minister Cameron described social exclusion as “… a shorthand label for what can happen when individuals or areas suffer from a combination of linked problems such as unemployment, poor skills, low incomes, poor housing, high crime environments, bad health and family breakdown.”
But there are also other recognised forms of poverty, such as 1) water poverty, which is defined by the government as spending more than 3 per cent of disposable income on water bills. Nationally, in 2006, nearly 10 per cent of households were in water poverty. 2) fuel poverty, which applies to a household which struggles to keep adequately warm at reasonable cost. The most widely accepted definition of a fuel poor household is one which needs to spend more than 10 per cent of its income on all fuel use and to heat the home to an adequate standard of warmth.
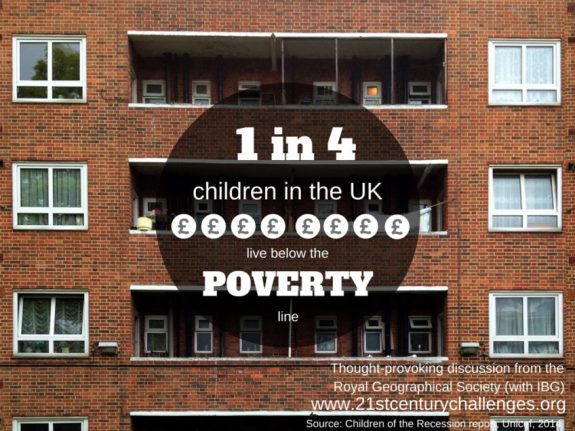
Defining the ‘poverty line’ as those individuals and households with incomes less than 60 per cent of their respective medians, in 2009-2010 the percentage of the population living in relative poverty stood at 17.1 per cent – before housing costs, and 22.2 per cent – after housing costs. As a result, 1) 17-18 per cent of the population are found to be in poverty at any one time consistently, from 1994-2004; 2) in 2003 to 2004, 21 per cent of children lived in households below the poverty line. After housing costs are taken into account, this rises to 28 per cent; 3) 3.9 million single people in the United Kingdom lived below the poverty line in 2005. Many of these people are divorced women; and 4) nearly 60 per cent of those in poverty were homeowners.
According to a recent study by four scientists of the Institute for Fiscal Studies, and their report which was supported by the Joseph Rowntree Foundation, the latest year of data available through the methodology of the Households Below Average Income system, despite falls in Gross National Product and employment, average take-home incomes continued to grow in 2009-2010. Median equivalised income in the United Kingdom grew by 0.9 per cent, from 410 pounds (AU$612 – in 2010) per week to 414 pounds (AU$618 – in 2010) per week – both in 2009-2010 prices, whilst mean income grew by 1.6 per cent, from 511 pounds (AU$763 – in 2010) to 519 pounds (AU$775 – in 2010). Taking the period from 1996-1997 to 2009-2010 as a whole, median equivalised income in the United Kingdom grew by about 1.6 per cent per year while mean income grew by 1.9 per cent per year, on average.
In 2010 a Eurostat report estimated that 17.1 per cent of Britons were at risk of poverty, after social transfers were taken into account.
In the then latest year of available data, income inequality was largely unchanged, and it remained steady from the beginning of the recession. Looking over that during 2008-2009 and 2009-2010, there has been growth across much of the income distribution, with the highest at the very top and relatively robust growth at the bottom of the income distribution – likely to reflect real-terms increases in benefits and tax credits seen over the periods. Those in the middle of the distribution saw relatively little growth.
Considering the 13-year period of Labour government as a whole, income inequality has increased. However, this increase in inequality is much smaller in magnitude than the rise in inequality which occurred during the 1980s. Moreover, inequality would have increased still further without the discretionary changes to taxes and benefits made by Labour during its 13-year period of government.
The most widely-watched measure of relative poverty in the United Kingdom is the proportion of individuals with household incomes below 60 per cent of the contemporary median. In the year 2009-10, the number of individuals living below this poverty line fell by 500,000 measuring incomes before housing costs but was unchanged measured after housing costs.
While Labour was in office, headline rates of relative poverty fell from 19.4 per cent in 1996-1997 to 17.1 per cent in 2009-2010 before housing costs and from 25.3 per cent to 22.2 per cent after housing costs. These falls in poverty were not continuous; poverty generally fell up to 2004-2005, rose for three years in a row and then fell again during the recession up to 2009-2010.
A Child poverty strategy laid out the government’s proposals for meeting the 2020 targets for the ‘eradication’ of child poverty. It emphasised increasing employment through welfare reform and additional childcare, and reductions in education and health inequalities. It also introduced a number of new indicators which would have been tracked in addition to the legislated income-based targets. There were sensible reasons for broadening measures of poverty beyond those based purely on income. However, it was doubtful whether these policies would have been enough to meet the extremely ambitious targets, particularly given the significant cuts to benefits, tax credits and public service spending planned in the years ahead.
There is no question that the Cameron government’s commitment to austerity opened a path to pain and stagnation to the poor of the United Kingdom. They would have been forced to suffer through years of unnecessarily high unemployment. They would also have had to endure cutbacks in support for important public services like healthcare and education.
For a while, it looked like things were going just as standard economic theory predicts: the economy is slowing and unemployment is likely to rise. Maybe the British populace would have tired of the rhetoric of austerity as a way to make politicians ‘feel good’ about tightening other people’s belts. Maybe the Liberal Democrats – it was hoped – would have broken away from the Coalition and forced new elections.
The conclusion appeared quite clear: austerity does not work and should not be tried.
By mid-October 2011 unemployment in the United Kingdom had jumped to its highest level since 1994, with young people hit hardest as private companies failed to make up for job losses in the public sector, piling pressure on the government to boost a stagnant economy. The government was quick to blame the rise in unemployment to 2.57 million on the ‘Global Financial Crisis’ and the Euro zone turmoil. But calls for it to ease its austerity plans increased as fears of a ‘lost generation’ of young people without hope of a job were growing. Economists also warned that people should brace for more bad news as employment numbers tumbled at recession-style rates. Deep cuts in state spending would eliminate more than 300,000 public sector jobs in coming years. Less than a week after the Bank of England launched a fresh round of stimulus to prevent a recession, the bank’s leading economist told Reuters news agency in an interview that the economy was likely to weaken further in the final quarter of 2011. The Office for National Statistics informed that the number of people without a job on the International Labour Organisation measure jumped by 114,000 in the three months to August 2011 to 2.57 million, the highest total since October 1994.
By October 2011 the jobless rate hit 8.1 per cent, the highest since 1996. Youth unemployment rose to 991,000, its highest since records began in 1992, driving the jobless rate among eligible 16 to 24-year-olds to 21.3 per cent. The number looked set to exceed the psychologically important 1 million mark. The government had been banking heavily on private firms to provide enough jobs to make up for the losses of public sector jobs, but economists said the drop in employment was worrying. The number of people in work had plunged 178,000 in June-August, the biggest drop since mid-2009 and the kind of decline which previously had only been seen during recessions.
Unions seized on the dire numbers to mount a fresh attack against the government. They charged that in the middle of the worst international recession for 80 years the government itself was creating unemployment with 250,000 public sector posts already gone and still more to come. Clearly the government policy was hurting and not working.
The Coalition of Conservatives and Liberal Democrats wanted to boost growth through lower corporate taxes, fewer labour market regulations and other supply-side measures. The Chancellor of the Exchequer, George Osborne had also announced a scheme to funnel loans more directly to credit-starved smaller firms, though this plan may not have taken effect any time soon.
Meanwhile the Bank of England had swung into action and begun to pump an additional 75 billion pounds (AU$112 billion – in 2012) into the economy in order to prevent a renewed recession. But doubts remained over whether this would be enough of a boost for the economy, which had barely grown over the previous year as consumers faced a combination of soaring prices, higher taxes and slow wage increases.
The Office for National Statistics’ figures showed that real incomes were still falling as pay increases fell even further behind inflation rates of nearly 5 per cent. Average weekly earnings including bonuses grew by 2.8 per cent. Analysts had forecast a rise of 2.9 per cent. Excluding bonuses, earnings rose only 1.8 per cent, below analysts’ forecasts of 2.0 per cent.
The Joseph Rowntree Foundation survey, Monitoring poverty and social exclusion 2011, published at the end of 2011, revealed the terrible scale of entrenched poverty in the United Kingdom.
The Rowntree report was based on data collected by the Department for Work and Pensions for 2009-2010, the latest year for which full data were available. Rowntree’s previous report, from 2008-2009, found that 13.5 million people – 22 per cent of the population in the United Kingdom – lived in poverty. The Rowntree figures revealed that in the 2009-2010 period, 22 per cent of the population were still officially living in poverty. The report also deducted housing costs and housing benefits from household income, and factored in the numbers, and ages, of people living in a household. On this basis, after taxes and housing costs had been deducted, 60 per cent of median income was calculated at 124 pounds (AU$185 – in 2012) per week for a single adult and 214 pounds (AU$320 – in 2012) for a couple with no children. It stood at 210 pounds (AU$314 – in 2012) for a single parent with two young children and 300 pounds (AU$450 – in 2012) for a couple with two young children.
The level of ‘deep poverty’ – household incomes of less than 40 per cent of the median – was also very high, with 10 per cent of the population affected. Poverty among children stands at 29 per cent and for old age pensioners at 16 per cent. The majority of people in poverty in Britain today are not those forced to live on lower than subsistence level welfare benefits, but are part of growing number of ‘working poor’.
The Rowntree report found that “Among working-age adults in poverty, 53 per cent live in working families (that is, either they or their partner are working).” Since 2001-2002 the increase in the number of working-age adults in poverty was 2 million. In 2009-2010 the number of working-age adults in working families who were living in poverty stood at 4 million.
Millions of children continue to live in poverty. In 2009-2010, 2.1 million children, more than half of all children in poverty, were living in working households. Child poverty was set to soar as a result of the austerity measures being imposed by the Conservative-Liberal Democrat government. The Exchequer’s own figures were drawn up after Chancellor George Osborne’s autumn budget statement acknowledged “an estimated increase of around 100,000 in 2012-13” in the child poverty figure. The government then attempted to claim that the Consumer Price Index rate of inflation was currently higher than the growth of average earnings, asserting that increasing benefits by the C.P.I. rate of inflation would eventually cause child poverty to fall.
This manipulation of figures was challenged by the Institute of Fiscal Studies, which confirmed that up to 100,000 more children would be pushed below the poverty line as a direct result of government policies.
Another study by Rowntree, published in October 2011, forecast that a further 700,000 children would have been pushed into poverty by 2020. The latest Rowntree report detailed the devastating extent of underemployment and unemployment in the United Kingdom. As a result, “in the first half of 2011, some 6 million people in the UK were underemployed. This had changed little from 2010. Underemployment had not been this high since 1993.”
Unemployment rose markedly since the period analysed by Rowntree, when 2.5 million people were officially unemployed. In the three months to October of 2011 unemployment hit its highest level since 1994, when it shot up by 128,000 to 2.64 million.
By the end of 2011 the Chartered Institute of Personnel and Development think tank warned that unemployment would have continued to rise to 2.85 million in 2012, stating that the private sector would not have been able to offset the 120,000 jobs set to go in the public sector. However, the C.I.P.D. report appeared to be wildly optimistic, as its figures were premised on there being no widespread new job loss losses in the private sector and a “relatively benign outcome to the euro zone crisis.”
According to official figures, up to 710,000 public sector jobs would have been lost by 2017. Tens of thousands of people had also been arbitrarily deprived of unemployment and disability benefit payments.
Rowntree’s study examined the scale of ‘fuel poverty’ in the United Kingdom, which had risen drastically over the previous decade. The report stated: “The proportion of households who struggle to keep their homes warm has risen for all tenure types since 2003. That year, around 6 per cent of all households were in fuel poverty.” Furthermore, “By 2009 18 per cent of all households, and 21 per cent of those in rented accommodation (social or private), were in fuel poverty. This threefold increase is the steepest of any indicator in this report. In 2009, some 4 million households were in fuel poverty.” This figure was superseded by the huge growth in ‘fuel poverty’, from nearly one in five households in 2010 to one in four in 2011. According to a contemporaneous report by statutory consumer body Consumer Focus, a quarter of all households in England and Wales had fallen into ‘fuel poverty’. The government had previously forecast that 2011 would have seen 4.1 million households in the United Kingdom in ‘fuel poverty’, but the Consumer Focus figures revealed that there were already more than 5 million households in ‘fuel poverty’ in England alone.
In 2012 millions more people would have been thrown into poverty due to the more than 2.5 billion pounds (AU$3.8 billion – in 2012) of reductions to tax credits, which top up the income of low income families. It was forecast that 2012 would have been the year cuts bite deepest.
Low-to middle-income households would have received 56 per cent of all tax credits in cash terms and would be hit disproportionately. A couple with two children and an income of 40,000 pounds (AU$ 60,000 – in 2012) a year would have seen their income fall by 8.9 per cent in 2011 and 2012, and by 14.5 per cent by 2013-2014.
At the beginning of 2012 some of the poorest areas of the United Kingdom, between 40 and 50 per cent of children lived in poverty, with areas of London featuring heavily. The situation has hardly changed for the better.
The ‘Child Poverty Map of the UK’ classified poverty as families claiming out-of-work benefits or in-work tax credits where income is less than 60 per cent of the median – in 2012 £25,000 a year. It might have slightly increased, but – presently – that would be the equivalent of AU$44,627 (as at 30 June 2018). At below 60 per cent of the median income, material deprivation leads to families struggling to meet basic needs like food, heating, clothing and the extra costs of schooling such as school trips.
After housing costs, household bills and general family spending needs will have to be met by approximately £12 (AU$21.42 as at 30 June 2018) or less per family member a day. For those families on benefits, this figure can be substantially less.
It is estimated that, today still, four in ten children are in poverty in 19 parliamentary constituencies, with 50 to 70 per cent of children facing poverty in 100 local wards.
London has some of the most deprived areas. Tower Hamlets borough, with a population of some 250,000, is the worst affected, with 52 per cent of children living in poverty. Islington is at number two, with Hackney, Westminster and Camden also in the top 10.
In other parts of the United Kingdom, such as Belfast West, Birmingham Ladywood, Liverpool Riverside and all stand at or above 46 per cent in terms of child poverty.
Manchester came out as third worst in the country, with the Manchester Central constituency recording a child poverty level of 49 per cent. In Manchester overall, 40 per cent of children are living below the poverty line.
In Scotland, the Springburn area of Glasgow has 52 per cent children living in poverty, and 44 per cent in the northeast area of the city.
Campaign to End Child Poverty executive director Alison Garnham said, “The child poverty map paints a stark picture of a socially segregated Britain where life chances of millions of children are damaged by poverty and inequality.”
Poverty will shorten lives. It is estimated that a boy in Manchester will live seven years less than a boy in Barnet and a girl from Manchester is expected to live six years less than a girl from Chelsea, Kensington and Westminster. Poor children are born too small, with low birth weights associated with infant death and chronic diseases in later life. Children growing up in poverty are more likely to leave school at sixteen with fewer qualifications. Two per cent of couples and 8 per cent of single parents are not able to afford two pairs of shoes for each child.
Continued Saturday – A cast of characters: The Monarchy (part 8)
Previous instalment – A cast of characters: The Monarchy (part 6)
 Dr. Venturino Giorgio Venturini devoted some seventy years to study, practice, teach, write and administer law at different places in four continents. He may be reached at George.venturini@bigpond.com.au.
Like what we do at The AIMN?
You’ll like it even more knowing that your donation will help us to keep up the good fight.
Chuck in a few bucks and see just how far it goes!
